Stock Turnover: Analysis Tab |
Top Previous Next |
Stock Turnover: Analysis Tab (Sales History Reports)
Go to Stock > Stock Turnover and select the Analysis - Summary of Data tab.
The Analysis Tab in the Stock Turnover module provides customizable, real-time summary reports on sales history.
Evaluate performance by employee, customer, stock item, stock group, and more. All data is pulled directly from Stock Turnover for 100% accuracy and up-to-date insights.
All data is sourced from Stock Turnover, ensuring that your sales history reports are both reliable and current.
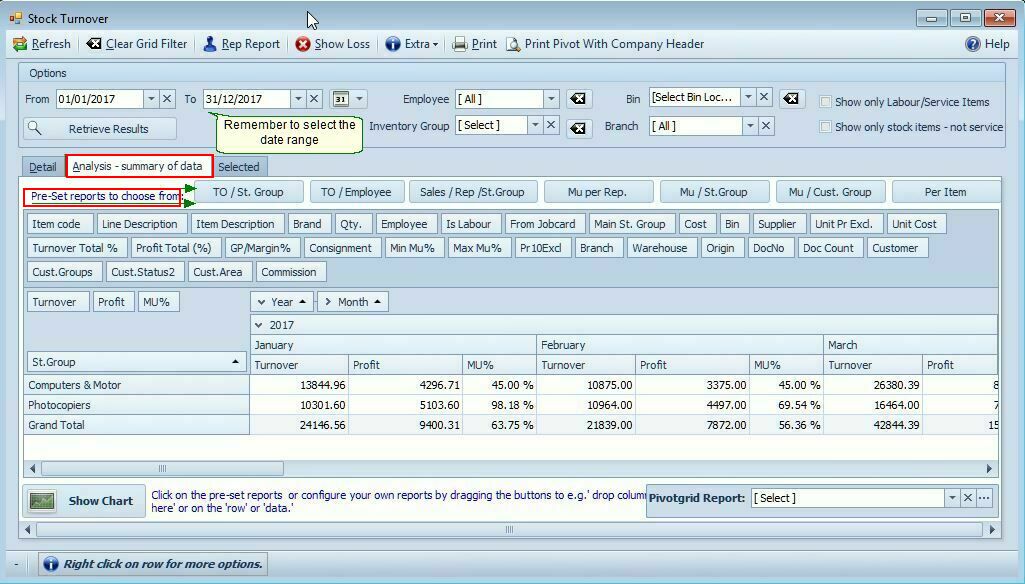
Pre-Set Summary Sales Reports in the Analysis tab
•Turnover, Profit, Markup % by stock group.
•Turnover, Profit, Mu % per employee or salesperson.
•Sales per Salesperson (Rep.) per Stock Group.
•The Analysis Tab in the Stock Turnover module provides customizable, real-time summary reports on sales history. Evaluate performance by employee, customer, stock item, stock group, and more. All data is pulled directly from Stock Turnover for 100% accuracy and up-to-date insights..
•Markup per Stock Group.
•Markup per Customer Group.
•Sales per Item
Sales Reports available in the Pivot Grid
At the bottom-right of the form, use the dropdown arrow to select from a range of Pivot Grid Sales Reports.
Available reports include:
•Salesperson Markup Comparison: Compare each salesperson’s markup with target min/max levels..
•Turnover per stock group: Analyze total turnover per stock group to identify which categories perform best.
•Best sellers: Generate a list of your top-performing products based on turnover per item.
•Sales per customer: View total sales and profitability per customer.
•Minimum and Maximum markups per stock group: Check whether sales stayed within the target markup range.
•Sales from the Workshop per Employee: Review sales or job performance for employees linked to workshop or service transactions.
Learn to design your own reports, go to Application > Analysis