Invoices & POS: Sales Overview |
Top Previous Next |
Hover the mouse over the different menu options. If the cursor changes to a hand (![]() ), then click to go to the subject.
), then click to go to the subject.
![]()
Sales Overview
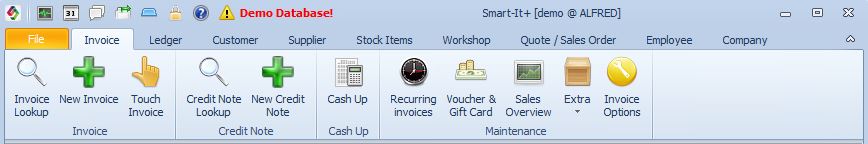
Go to: Invoice > Sales Overview
The Sales Overview, also known as Sales History, provides powerful tools to analyze customer sales activity and track which items were purchased by each customer. This module helps you identify buying patterns and make informed decisions on pricing, stock, and customer engagement.
Key Features
•Analyze historical sales data per customer and item
•Identify customer buying trends and payment behavior
•Compare sales performance across employees, tills, and periods
•Visualize data using charts and pivot grids
Filtering and Custom Reports
You can customize Sales Overview reports using the following options:
•Filter reports by any date range.
•Use pre-set reports for quick access.
•Display figures in chart format for visual analysis.
•Save frequently used custom views as Grid Reports for quick access from the grid dropdown.
•Print, export, or email reports directly from the form (use the menu Print button)

Sales Overview
Sales Overview Pre-Set Reports (Sales History)
•Payment Type % Breakdown
Shows the percentage share of each payment method (e.g., Cash, EFT, Loyalty Cards, Vouchers, On Account).
•Payment Type Amount Breakdown
Displays the actual amounts paid per payment method (Cash, Cards, Cheque, EFT, Loyalty, Voucher, On Account, etc.).
![]() Payment breakdowns are also accessible from the Receipt Lookup form.
Payment breakdowns are also accessible from the Receipt Lookup form.
•Turnover Per Customer will give you your top customers or in other words your highest turnover customers.
•Shows total sales per customer
•Right-click on a column heading (for example, the Year column)
•Select Sort Customer by This Column to identify top-spending customers
![]() Note:Turnover per Customer per item is also available from Stock Turnover.
Note:Turnover per Customer per item is also available from Stock Turnover.
•Per Month Per Pay Type (Cash versus On-Account)
•Compare how many sales are completed using cash versus on-account terms over time.
Reports you can select from the saved Pivot Grid reports
•Sales Per Employee Per Month -- Monthly contribution per employee for performance tracking.
•Turnover Per Till -- Compare sales turnover across different tills or sales terminals.
•Payments per Day – View daily payment activity
•Sales per Lead Source – Evaluate marketing performance by comparing sales from different lead sources (website, walk-in, referrals, etc.).
•Customer Purchase Frequency – Measure how often customers buy. Useful for retention tracking.
•Number of Documents per Customer -- Counts invoices, quotes, and related documents per customer.
•Sales Per Employee Per Month – Shows how many customers assigned to each sales representative made purchases during the month.
Best Practice Tips
•✅ Save commonly used views as Grid Reports for instant access.
•✅ Combine Sales Per Customer with Customer Purchase Frequency for loyalty insights.
•✅ Use Payment Type Breakdown to optimize payment method offerings.