Financial Statements |
Top Previous Next |
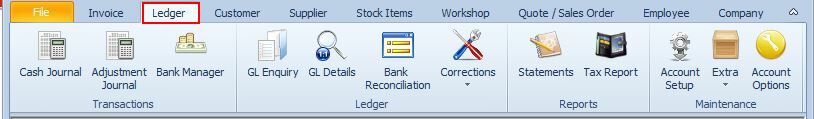
Hover the mouse over the different menu options. If the cursor changes to a hand (![]() ), then click to go to the subject.
), then click to go to the subject.
![]()
![]()
Generating Financial Statements
Go to: Ledger > Statements
Use this section to generate key financial reports quickly and accurately. Financial statements can be customized by date range, summary level, branch, account visibility, and level of detail.
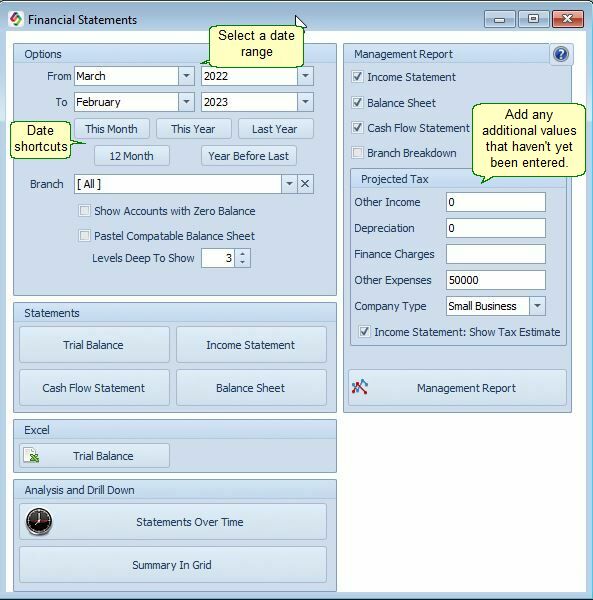
Financial Statement Options
Customize what data appears and how it's structured:
1. Date Range
Select the reporting period. This determines which transactions are included in all statements.
2. Summary Level
Choose the summary level: week, month, quarter, or year.
3. Branch Selection
Choose a specific branch or leave blank to generate a combined (company-wide) statement. Ideal for multi-branch businesses.
4. Show Accounts with Zero Balance
Enable this option to include all accounts in your report, even those with zero balances.
5. Levels Deep to Show
Control the level of detail for accounts with sub-accounts. For example, setting this to 1 will display only parent accounts, while 3 will show parent accounts and their sub-accounts up to three levels deep.
Once customized, select the type of statement you want to generate or view.
Available Financial Statement Types
•Trial Balance
Displays beginning balances, total debits, total credits, and ending balances per account.
Use it to: Verify that debits = credits (accounting accuracy check) and review account balances before preparing other reports.
•Balance Sheet
A snapshot of your business's financial position at a specific date.
Shows: Assets (what you own), Liabilities (what you owe), and Equity (owner's stake).
Use it to: Assess overall financial health, liquidity, and net worth.
•Income Statement (Profit & Loss)
Shows revenues, expenses, and profit/loss over the selected period.
Organized by groups and individual accounts for detailed insights.
Use it to: Understand profitability, track income vs. costs, and identify trends.
•Cash Flows
Tracks actual cash movements (inflows and outflows) during the period.
Highlights operating, investing, and financing activities.
Use it to: See where cash really comes from and goes — crucial since profit ≠ cash on hand.
•Management Report
Customizable combined overview pulling from multiple statements. Branded/packaged management reports (add logos, summaries, charts in one export).
To design your own: Go to Ledger > Account Options > Printing
Use it to: Create tailored reports for management review or board meetings.
• Projected Tax
• Input estimated/pending values (e.g., future expenses, uncaptured income).
• Displays estimated tax on the Income Statement.
• Use it to: Displays estimated tax on the Income Statement.
Notes
Financial statements can be:
•Export reports to Excel, PDF, or CSV for further analysis.
•Email reports directly to stakeholders
Financial Statements Over Time – Historical & Graphical View
Track financial performance trends using historical summaries and interactive graphs.
•Summary Level
•Select the Summary Level (week, month, quarter, or year) for aggregated view.
•Comparative Periods – Compare side-by-side:
•View week, month, quarter, or year historical data, such as, profit per month side-by-side.
•Current period vs previous period
•Current period vs same period last year
•Month-to-date / Year-to-date
•Historical monthly/quarterly data (e.g., profit trends over 12 months)
•Display multiple graphs at once (e.g., sales and cost of sales overlaid on the same chart).
•Use the row selector to pick exactly which accounts or groups to include.
•Consolidated views across branches for group-level analysis.
•Toggle between Summary (pivot grid tab) and Detailed views (detail grid tab).
•Advanced visuals — Add trend lines, regression, or EMA for forecasting insights.
Drill-Down & Transaction Access
•Right-click any account or figure to view underlying transactions.
•Drill further into source documents (e.g., invoices, journals, payments) for full audit trail and verification.
Scenario & Forecast Mode
Graphical trend analysis tools include:
•Actual values
•Regression trend lines
•EMA (Exponential Moving Average) lines
Related Financial Analysis Features
The following advanced tools are available in related areas of the system:
•Financial Ratios (including industry benchmarks):
Go to File > Dashboard > Financial > Magnifier Icon
•Real-Time / Live Dashboards:
Go to File > Dashboard
•Built-in Budget vs Actual Reporting:
Compare budget, actual, variance, and variance %
Go to Ledger > Extra > Budget
Summary In Grid
A powerful pivot grid (dynamic table) for slicing and dicing data:
•Drag fields to rows/columns/filters.
•Apply filters (e.g., date ranges, branches, accounts).
•Reorganize without altering source data.
•Switch to detailed grid tab for transaction-level views.
Financial Ratios
For more information see KPI Targets
Cashflow Overview
Your cash position is shown in graph format. Showing you actual cash, your future cash position as predicted by regression analysis and Exponential Moving Average (EMA)