Financial |
Top Previous Next |
![]()
![]()
![]()
Financial Dashboard
Go to File > Dashboard
The Financial Dashboard provides a real-time, auto-refreshing view of your company’s financial health.
Smart-IT automatically calculates and updates key financial indicators as transactions are posted.
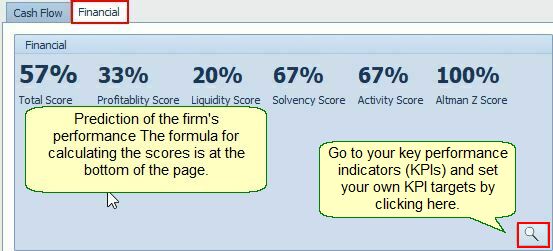
Setting KPI Targets
Click the Magnifier Tool (see image above) to:
•Select KPIs to display
•Set custom KPI targets
•Adjust ratio thresholds
•Define acceptable performance ranges
Targets can be changed at any time.
KPI Calculation Notes
•Financial Position Analysis uses Current Month - 1 data.
•Gross Profit target defaults to the previous month unless changed.
•Gross Profit Margin Target: Click Edit > Settings to modify.
•Ratios are only accurate if General Ledger accounts are correctly configured.
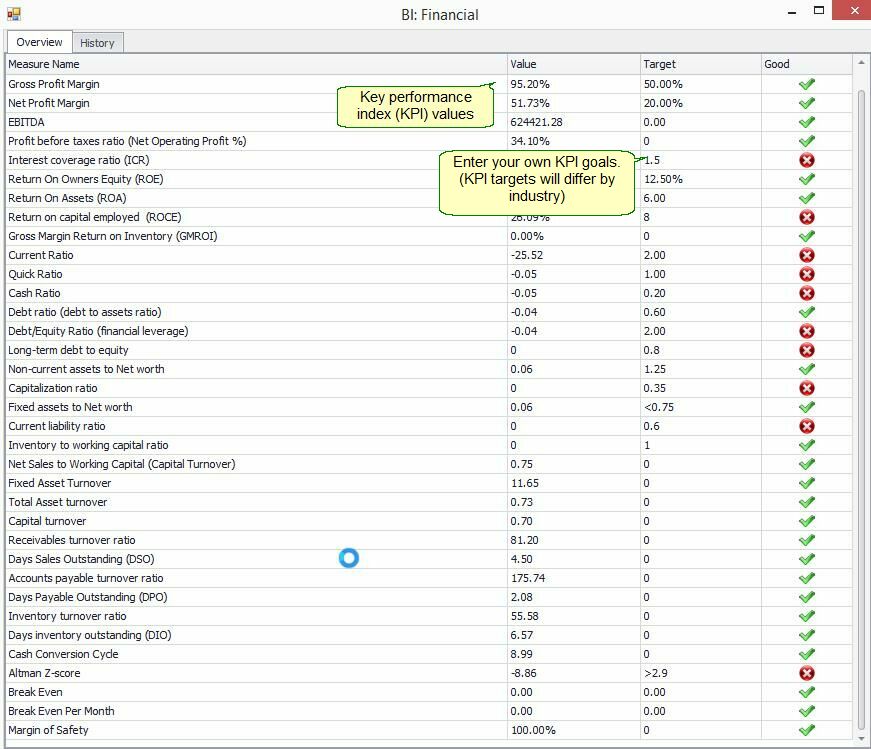
Key Performance Index
Profitability Ratios
Ratios |
Formula |
Target |
Meaning |
Gross Profit Margin % |
Gross Profit % = Sales - COGS / Sales *100 |
>23 |
Measures pricing power and cost control. Declining % may signal rising costs, discounts, or theft in retail. |
Net Operating Profit % |
Net Profit before taxes / Sales *100 |
8 - 12% |
If the Net Operating Profit % is much larger than the Net Profit %, then it means that the Non-Operating Expenses play a very important role.
|
Net Profit % |
(Net Profit before taxes + Non Operating) / Sales x 100
|
>5 |
A declining % can indicate that the relationship between operating expenses and income needs attention. |
EBITDA |
Earnings before interest, taxes, depreciation and amortization |
N/A (track as absolute; aim for positive growth) |
Core earnings power, useful for retail with high fixed assets like stores. |
Return on Equity % (RoE). |
Annual net income after taxes / Average Equity Or RoE=Profitability*Efficiency*Leverage |
>15% |
A key indicator of business profitability. The amount of net income returned as a percentage of shareholders equity. Return on equity measures a corporation's profitability by revealing how much profit a company generates with the money shareholders have invested. Check what the main driver is in a change in RoE; whether it is a change in value of assets, liabilities or the net profit.
|
Return on capital employed (ROCE) |
EBIT / Capital Employed (equity plus non-current liabilities
|
>10% |
ROCE reflects a company's ability to earn a return on all of the capital it employs. There is no set benchmark, market commentators argue that ROCE should be higher than inflation, or up to double the interest rate. A higher ROCE means that a company will have more money to invest back into the business and help it achieve higher earnings per share. A lower ROCE may indicate that the company is not employing its capital effectively.
|
Gross Margin Return on Inventory (GMROI) |
Gross Profit / Inventory |
>3 |
Measures the gross margin returned for each dollar invested in inventory. (Higher is better) |
Return on Assets % (ROA) (Asset efficiency) |
Profit Before Taxes / Total Assets |
>5 |
Measures how effectively you utilized your company’s assets to make a profit. It is a common ratio used to compare how well you performed in relationship to your peers in your industry. (The larger the better) |
Interest coverage ratio (ICR) |
EBIT / Interest Expense |
>3 |
A measure of how well a company can meet its interest-payment obligations. A value of 2 for example will mean that the Company is able to meet its interest payments two times over. |
Short Term Liquidity Ratios - Is an Organization Solvent |
|
||
Current Ratio (Working capital ratio) |
Current Assets/Current Liabilities
|
>=2 |
Ability to meet current debt obligations. Measures how well you can cover current liabilities with liquid assets. Acceptable value: 2 or more (Higher is better; 2.0 is average.) There is X in current assets to pay every R1.00 in current liabilities |
Quick Ratio (Acid-test ratio) |
Cash+Accounts Receivable / Current liabilities Or (Total Current Assets -Total Inventory) / Total Current Liabilities |
>0.5
|
Test the degree of solvency more strictly, using only the most liquid current assets. Ratios between 0.5 and 1 are considered satisfactory. (The larger, the better) There is R x.xx in quick assets (liquid) to pay every R1.00 in current liabilities. |
Cash Ratio |
Cash + Cash Equivalents / Current Liabilities |
>=0.02
|
Ultra-conservative liquidity. Low in retail due to cash tied in ops, but ensures emergency coverage.
|
Financial Sustainability |
|||
Debt-to-Equity Ratio |
Total liabilities/ Total Owners equity |
<=1.5 (0.43 - 1) |
Provides another measure of the funds provided by creditors versus the funds provided by owners. Measures the financial strength of the business. (Lower is better; 1.0 is average). If the Debt-to-Worth Ratio is greater than 1, the capital provided by lenders exceeds the capital provided by owners. Bank loan officers will generally consider a company with a high Debt-to-Worth Ratio to be a greater risk. Debt-to-Worth Ratios will vary with the type of business and the risk attitude of management. The creditors have put $x.xx in the business for every $1.00 the owners have put in. Acceptable value: no more than 1.5 (optimum 0.43-1).
|
Debt Ratio (Debt to Assets Ratio)
|
Total Liabilities / Total Assets |
<=0.6 (0.3-0.5) |
It shows how much the company relies on debt to finance assets. Indicates the % of assets financed with debt or liabilities. Or Measures the extent to which borrowed funds have been used to finance the firm's operations
|
Fixed assets to net worth |
Fixed Assets / Net worth (equity) |
<=1.25 |
Shows the portion of your company's total assets that is tied up with fixed assets. It shows the extent to which the company funds are frozen in the form of fixed assets, such as property, plant and equipment. It represents the portion of total assets that cannot be used as working capital. A ratio higher than 0.75 indicates that the firm is vulnerable to unexpected events and changes in
|
Capitalization ratio |
Long-term Debt / (Long-term Debt + Equity) |
<.35
|
Long-term debt is divided by the sum of long-term debt and shareholders' equity. This ratio is considered to be one of the more meaningful of the "debt" ratios - it delivers the key insight into a company's use of leverage. Large companies usually 35%
|
Fixed assets to Net worth |
Fixed Assets / Equity |
<=0.75
|
This ratio indicates the extent to which the owners' cash is frozen in the form of fixed assets, such as property, plant, and equipment, investment property and non-current biological assets. A ratio 0.75 or higher is usually undesirable because it indicates that the firm is vulnerable to solvency problems. Comparing your fixed-assets-to-net-worth ratio against industry-average ratios can tell you whether your ratio is better or worse than your competitors. High ratios can be interpreted as liquidity problems, because it means the company does not have immediate access to cash
|
Current liability ratio |
Non-current liabilities / Total liabilities |
||
Working Capital |
Total Current Assets - Total Current Liabilities |
>0 |
Positive working capital is required to ensure that a firm is able to continue its operations and that it has sufficient funds to satisfy both maturing short-term debt and upcoming operational expenses. The management of working capital involves managing inventories, accounts receivable and payable, and cash. Lenders use it to evaluate a company’s ability to weather hard times |
Z-Score |
(1.2 * (Current Assets - Current Liabilities)/Total Assets) + (1.4 * Retained Earnings/Total Assets) + (3.3 * EBIT/Total Assets) + (0.6 * Market Value Equity/Book Value Liabilities) + (1.0 * Sales/Total Assets) |
>2.99 |
A very accurate guide to your company’s financial solvency. A Z-Score of 1.81 or below means you are headed for bankruptcy. Conversely, a Z-Score of 2.99 means your company is sound. |
Working Capital Analysis |
|||
1 Net Working Capital (NWC) - R.c |
Current Assets - Current Liabilities |
Positive; monitor as R value |
A company can be endowed with assets and profitability but short of liquidity if its assets cannot readily be converted into cash. Positive working capital is required to ensure that a firm is able to continue its operations and that it has sufficient funds to satisfy both maturing short-term debt and upcoming operational expenses. Sources of working capital are (1) net income, (2) long-term loans, (3) sale of capital assets, and (4) injection of funds by stockholders. Ample working capital allows management to take advantage of unexpected opportunities, and to qualify for bank loans and favourable trade credit terms. In the normal trade cycle of a company, working capital equals working assets. Also called net current assets. |
2 Inventories, thousand R.c |
Inventory Value |
||
Working capital sufficiency (1-2), thousand R.c |
Current Assets - Current Liabilities - Inventory |
>0 |
Liquidity without inventory. Key for perishable/low-turnover retail. |
Inventory to working capital ratio (2:1) |
Inventory / NWC |
<=1
|
Inventory burden on capital. High signals overstock risk. |
Net Sales to Working Capital. (Working Capital Turnover) |
Net Sales / Net Working Capital |
5-10x (upward trend good)
|
The relationship between Net Sales and Working Capital is a measurement of the efficiency in the way working capital is being used by the business. It shows how working capital is supporting sales. A spike in the ratio could be caused by a decision to grant more credit to customers in order to encourage more sales, while a dip could signal the reverse. A spike might also be triggered by a decision to keep more inventory on hand in order to more easily fulfil customer orders. Again, this ratio must be compared to others in your industry to be meaningful. In general, a low ratio may indicate an inefficient use of working capital; that is, you could be doing more with your resources, such as investing in equipment. A high ratio can be dangerous, since a drop in sales, which causes a serious cash shortage, could leave your company vulnerable to creditors. Considerations A working capital turnover that is too high can be misleading. On the surface, it appears that you are operating at a very high efficiency, but in reality, your working capital level might be dangerously low. Very low working capital can possibly cause you to run out of money to fund your business. |
Business Activity (Turnover Ratios) |
|||
Fixed Asset Turnover |
Net Sales / Fixed Assets |
>5-8x (higher better) |
A measure of the sales productivity and utilization of plant and equipment. The higher the ratio, the better, because a high ratio indicates the business has less money tied up in fixed assets for each unit of currency of sales revenue. A declining ratio may indicate that the business is over-invested in plant, equipment, or other fixed assets. Measures the amount of sales a business generates for every dollar invested in fixed assets
|
Total Asset Turnover |
Net Sales / Total Assets |
>1.5-2.5x |
Measures the amount of sales a business generates for every dollar invested in total assets. |
Capital Turnover |
Net Sales / (Equity + Long-Term Debt) |
>2-3x |
Capital productivity. |
Inventory Turnover Ratio |
COGS / Average Total Inventory |
4-10x (fashion 6-12x; furniture 2-5x) |
The Inventory Turnover Ratio measures the number of times inventory “turned over”. It is a good indication of purchasing and production efficiency On average, the inventory turns over x times a year
|
Inventory Days On Hand |
365 days / Inventory Turnover ratio |
30-90 days (lower for fast-moving goods) |
On average, the inventory turns over every x days. |
Accounts Receivable Turnover Ratio (Debtor's turnover ratio)
|
Net Credit Sales / Average Accounts Receivable during a given period.
|
>8-12x |
The receivables turnover ratio is an activity ratio measuring how efficiently a firm uses its assets. Receivables turnover ratio can be calculated by dividing the net value of credit sales during a given period by the average accounts receivable during the same period. |
Accounts Receivable Days on Hand |
365/ (Net Credit Sales / Ave. Acc. Receivable)
|
30-45 days |
A measure of the average length of time it takes the firm to collect the sales made on credit |
Accounts Payable Turnover ratio
|
Total Purchases (cost Of sales) / Ave. Acc. Payable |
6-10x |
Payment speed to suppliers. Accounts payable turnover ratio is calculated by taking the total purchases made from suppliers, or cost of sales, and dividing it by the average accounts payable amount during the same period.
|
Accounts Payable Days |
365/(Tot. Purchases / Ave Acc. Payable) |
30-60 days |
Days to pay suppliers. Extend for better cash flow without penalties. |
Cash Cycle (Trading Cycle) |
Accounts Receivable Days + Inventory Days – Accounts Payable Days = Cash Cycle |
30-60 days (lower better) |
This means it takes approximately X days from the time they purchase inventory, complete the sale of the inventory and collect on the sale of the inventory. You could say they need to have X days of operating expenses in reserve or available to cover the cash cycle.
|
Breakeven |
Operating Costs / GP% or Fixed Costs / (Fixed Costs + Profit) *100
|
Track as sales threshold |
Minimum sales to cover costs. Vital for retail planning. |
Safety Margin |
(Sales - Breakeven Sales) / Sales *100 |
>20-30% |
What % of sales can be 'lost' before the business will enter a loss position. |
Other |
|||
Sales Per Employee |
Net Sales / Number of Employees |
Labor productivity. |
|
Profit per Employee |
Net Profit / Number of Employees |
Profit efficiency per worker. |
|
KPI History Tab
Go to the History Tab to:
•View last 12 months KPI trends
•Compare month-to-month variances
•Identify improving or declining trends
The report is colour-coded:
•Green = On or Above Target
•Red = Below Target
Improving Ratios
Example: To improve the Current Ratio, you can:
•Pay down short-term debt
•Convert short-term debt into long-term loans
•Sell fixed assets
•Retain profits in the business
•Improve collections (reduce AR days)
•Reduce excess inventory
https://bit.ly/SI_Dashboard_Financial