Invoice Lookup Analysis |
Top Previous Next |
Hover the mouse over the different menu options. If the cursor changes to a hand (![]() ), then click to go to the subject.
), then click to go to the subject.
![]()
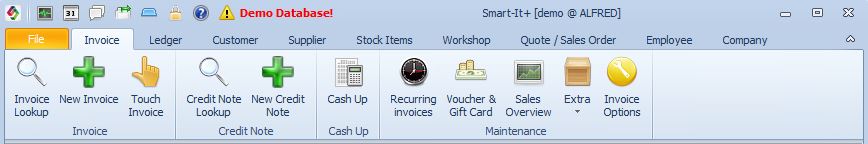
Invoice Lookup Analysis Tab
Analysis Features
In the Analysis tab, you can:
1.Use pivot grids to organize and filter data.
2.View summaries for quick insights.
3.Generate graphs to visualize trends.

1. Select the data you want to display by clicking on the pre-set reports, or create your own report.
2. To customize your report:
•Drag the Inv.Type. label next to the Total Incl. label.
•Move the Discount Amt. label to where Total Incl. was.
•Replace the Employee label with the Customer label.
3. Drag and drop the labels to get a feel for it.
To show the chart.
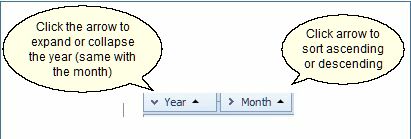
1 Double click on for e.g. on Alfred or John.
2 You can show more than a single line by high lighting (click and drag) the cells you want to display and then click on the Chart tab.
![]() Pre-Set Reports in the Invoice Lookup Analysis Form
Pre-Set Reports in the Invoice Lookup Analysis Form
The Invoice Lookup > Analysis tab provides a range of ready-made reports, giving you powerful insights into your sales activity. These reports help you quickly analyze performance, trends, and team contributions.
•Cash versus On-Account: Compare how many sales are done on cash versus account terms.
•Sales per Salesperson: Track performance per salesperson over a given time period.
•Sales per Customer per Date: Useful for seeing repeat business and identifying peak customer activity.
•Discount per Salesperson: Monitor how much discount each salesperson is giving—helpful for managing profitability. (Usage - See which salesperson is giving the most discount - is his sales higher than the other salespersons that gives less discount?)
•Date and Time information.
•Which days of the week generate the most sales.
•What times of day are busiest.
![]() Fields You Can Use to Create Custom Reports:
Fields You Can Use to Create Custom Reports:
You can also build your own reports using fields like:
•Total Discount Amount
•Branch
•Turnover Change %
•Invoice Type
![]() Tip: Use the built-in filters and drag-and-drop layout in the pivot grid to customize the reports to your needs.
Tip: Use the built-in filters and drag-and-drop layout in the pivot grid to customize the reports to your needs.