Dashboard |
Top Previous Next |


Dashboard
Go to: File > Dashboard
Alternatively, click the Dashboard icon  in the Quick Access Toolbar.
Overview
The Smart-IT Dashboard is a visual summary screen that gives you an instant overview of the financial health and activity of a business. Instead of opening multiple reports, key information is displayed in one place using charts, graphs, and performance indicators..
Note: The Dashboard gives only a summary. For detail information go to the different reports in each module.
Automatic Dashboard Display
You can configure Smart-IT to open the Dashboard automatically when an employee logs in.
To enable or disable this feature:
1. Open the Employee, form.
2. Locate the Dashboard setting.
3. Specify whether the Dashboard must open automatically when that employee logs in.
This setting can be configured individually for each employee.
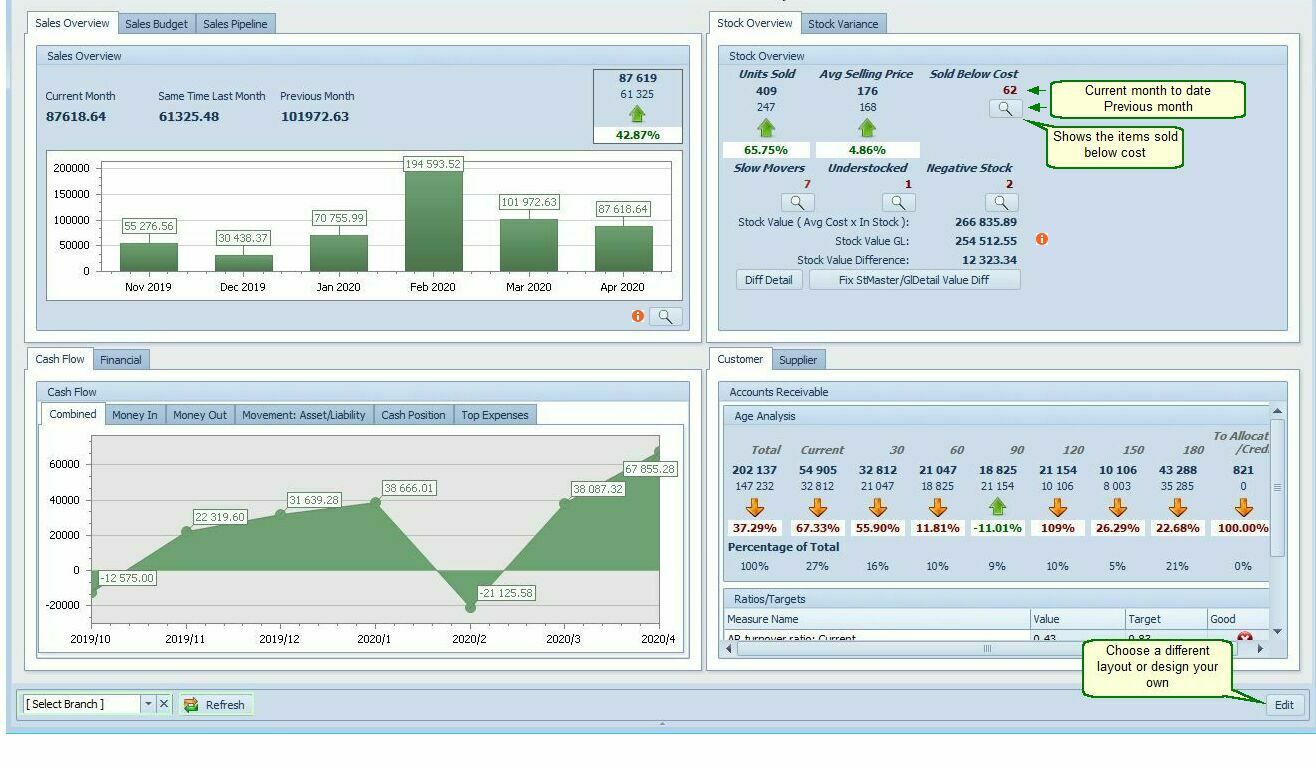
Using Your Dashboard
Step 1. Select Your Branch
If your company uses multiple branches, select the required branch from the branch selection field at the bottom-left corner of the Dashboard.
Step 2. Select a Dashboard Layout
Smart-IT provides several predefined Dashboard layouts designed for different business roles.
To change the Dashboard layout:
1. Click Edit at the bottom-right corner of the Dashboard.
2. The Design Layout, Security Settings and Layout selection screen will open.
3. Select the required Dashboard layout from the selection area at the bottom-left of the screen.
The following predefined layouts are available:
•Admin Dashboard: Shows Accounts Receivable, Supplier Age Analysis and Stock Overview
•Default Dashboard: Displays the standard Default Dashboard layout.
•Management Dashboard: Displays Sales Overview, Cash Flow, Financial's, Stock Overview, and Sales Pipeline.
•Sales Dashboard: Shows Sales Overview and Sales Pipeline.
•Stock Dashboard: Shows Stock Overview and Supplier Age analysis.
Step 3: Customise Your Dashboard
From the Design Layout screen, you can further customise your Dashboard.
•Click Design Layout to create or modify your Dashboard layout, including the arrangement and size of dashboard items.
•Click Settings to configure Dashboard Security Settings.
For more information, see Customizable Dashboards.
Available Dashboards and Reports
The Dashboard provides summaries and visual overviews of important financial and operational information. It allows users to monitor business performance at a glance without having to run individual reports.
Important: Dashboard information is intended as a summary. More detailed reports are available in the relevant Smart-IT modules. Where applicable, the detailed report provides additional information, analysis and transaction-level detail.
Sales Dashboard
Provides an overview of current sales compared with previous periods and displays the percentage increase or decrease between the selected periods. This helps you monitor sales trends and identify changes in business performance.
For a detailed analysis, see:
•Ledger > Statements > Statements Over Time
Provides an overview of actual sales and profitability compared with budgeted figures, allowing management to monitor performance against targets.
For a detailed analysis, see:
Provides an overview of potential sales opportunities and sales activity.
For a detailed analysis, see: Customer > Extended Lookup > Analysis tab.
Inventory Dashboard
Stock Overview
Provides an overview of inventory performance, stock levels and potential stock-related issues.
For a detailed analysis, see:
•Stock Items > Stock Turnover > Analysis tab.
•Stock Items > Extra > Inventory Statistics
Provides information about stock variances, helping you identify and investigate differences in inventory.
For a detailed analysis, see: Go to: Stock Items > Stock Take. Click the dropdown arrow and select Stock Take Detail.
Financial Dashboard
Provides an overview of cash flow to help monitor the movement of money into and out of the business.
For a detailed analysis, see: Ledger > Statements > Cash Flow
Provides an overview of cash flow to help monitor the movement of money into and out of the business.
For a detailed analysis, see: Ledger > Statements
Displays Key Performance Indicators (KPIs) used to measure and monitor business performance.
See: Dashboard > Financial
Click the Magnifying Glass at the bottom-right of the Financial form.
For a detailed analysis see Dashboard > Financial and click the Magnifying Glass  (bottom-right of the Financial form).
Customer Dashboard
Provides a summary of Customer Age Analysis and customer ratios.
For a detailed Customer Age analysis report, see: Customer > Age Analysis
Supplier Dashboard
Provides a summary of Supplier Age Analysis and ratios.
For a detailed Supplier Age Analysis report, see: Supplier > Age Analysis
Instructions for the AI Bot – Dashboard vs Detailed Reports
The Dashboard provides summaries, overviews and visual representations of business information. It is not necessarily the detailed report itself.
When answering questions about Dashboard information, follow these rules:
1. Identify the user's requirement.
• If the user wants a quick overview, explain where to find the relevant Dashboard section.
•If the user wants detailed information, further analysis, transaction details or a breakdown, direct the user to the relevant detailed report listed under "For a detailed analysis, see".
2. Always distinguish between the Dashboard and the detailed report.
Do not tell users that the Dashboard contains all the information available in the detailed report.
3. Proactively guide users to detailed reports.
If a user asks how to investigate or analyse figures displayed on the Dashboard, provide the relevant menu path to the detailed report.
4. Do not confuse Dashboard sections with report locations.
The Dashboard is accessed through File > Dashboard. The detailed reports are accessed through their respective Smart-IT modules and menu paths.
5. Use the documented menu paths.
Do not invent alternative report locations or assume that a Dashboard section contains additional drill-down functionality unless specifically documented.
Example questions and responses:
User asks: Where can I find a detailed Sales Overview?
Bot response: The Sales Overview is available on the Dashboard. For a more detailed analysis of sales, go to Invoice > Sales Overview. You can also use Ledger > Statements > Statements Over Time for period comparisons.
User asks: Does the Stock Overview show detailed stock turnover?
Bot response: The Stock Overview on the Dashboard provides a summary of inventory performance. For a detailed analysis, go to Stock Items > Stock Turnover or Stock Items > Stock Turnover > Analysis.
User asks: Where can I find the detailed Customer Age Analysis?
Bot response: The Customers Dashboard provides a summary of customer age analysis. For the detailed report, go to Customer > Age Analysis.