Lookup - Analysis - Summary of Data |
Top Previous Next |
Watch the videos: Grid Report Lookups
Lookup Analysis - Summary of Data
Where to find: Most of the Lookups have an Analysis (Summary of data) tab and a Chart tab. See image below.
Use the Lookup or Detail tab to select the data you want to use and then the Analysis tab to get a summary of your data.

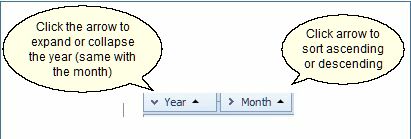
Select the data you want to display by clicking on the pre-set reports, or you can put together your own reports, e.g. drag the Inv.Type. label next to the Total Incl. label. See the brown arrow above.
Drag now the Discount Amt. label to where the Total Incl. label was.
Replace the Employee label with the Customer label. Drag and drop the labels to get a feel for it.
To show the chart.
1 Double click on for e.g. on Alfred or John.
2 You can show more than a single line by high lighting (click and drag) the cells you want to display and then click on the Chart tab.